How I Measure Results
Most SEO reporting stops at rankings or traffic. Mine doesn’t. I built my own dashboard that follows every engagement from Google visibility through clicks to signups, demos, or sales, and measures every change I make against the weeks before it, rather than a vague sense that things got better.
This is the system behind the DTC ecommerce result on the homepage and in the case study: £102K to £200K in monthly DTC revenue, +96%, in 10 weeks. The same dashboard tracks every client I work with, whether that’s ecommerce, SaaS, or manufacturing: rankings and traffic are a means, pipeline and revenue are the point.
The pipeline I actually track
For a SaaS client, stage 3 becomes signups or demo requests instead of orders. The pipeline is the same shape either way.
Every change gets tested with before-and-after data #
I don’t publish a piece, wait a few weeks, and call it a win if traffic looks up. Every change I log, a rewrite, a new page, a price change, a link, gets measured against the same window of time before it, and checked against what the rest of the site did over that period, so a seasonal swing doesn’t get credited to a paragraph I rewrote.
4 weeks before
Ranking, clicks, and conversions on the page as they stood, logged the day the change goes live.
4 weeks after
The same measures, same length of time, compared against what the rest of the site did too, so the number I show you is the change, not the season.
The dashboard behind all of this #
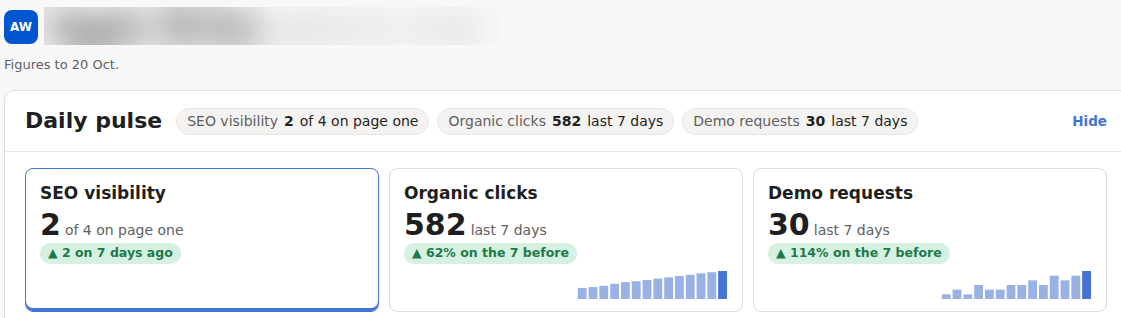
Here’s an illustrative example of what that tracking actually looks like, for an HR tech client, with the holistic view I check first every time I open the dashboard: visibility, clicks, and the thing that actually matters, demo requests.
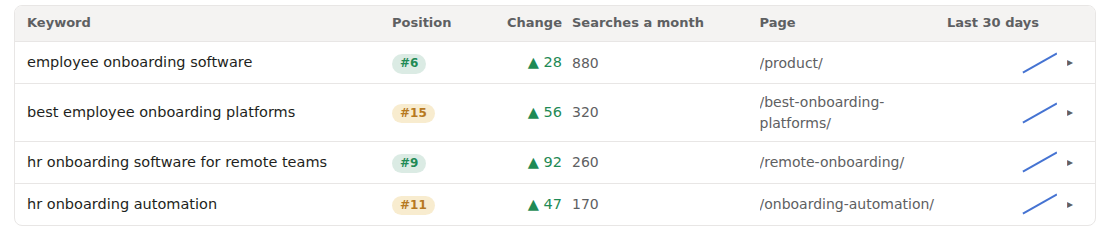
And here’s the keyword-level detail behind that visibility figure, a handful of employee onboarding software-type keywords climbing after the technical and on-page work goes live:
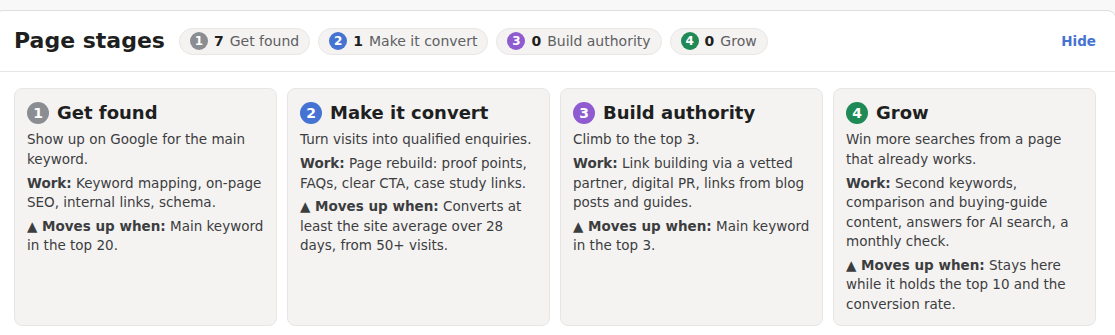
Here’s the same framework live, the four stages every page I track moves through, from “does Google know this page exists” to “is it actually winning more searches than it already does.”
Rankings and clicks aren’t the finish line any more #
Being found in Google only gets you half the way there now. I track whether pages are actually showing up inside the AI tools your buyers ask first, and I build every page so it has a real chance of being quoted, beyond simply indexed:
Answer first
The first few sentences of a key page answer the actual question directly, with real numbers, ahead of any preamble.
FAQ with real schema
Real questions your buyers actually ask, short answers, marked up so an AI tool can lift them cleanly.
Comparison tables
AI answers lean on tables for anything comparable, pricing, features, specs. A page without one is a page that doesn't get quoted.
Tracked monthly
AI visibility and AI-referred traffic are tracked on the same dashboard as everything else, backed by measured results.
Why this matters more for B2B SEO than it sounds #
A page that ranks but never gets seen by anyone close to buying is a vanity metric. The dashboard exists so that doesn’t happen quietly. Every piece of work is tied to what it’s actually supposed to do, pipeline for a SaaS company, RFQs for a manufacturer, orders for an ecommerce brand, and if it isn’t doing that job, the numbers say so before three months go by and nobody noticed.
See current pricing for what this looks like at each tier, or get in touch if you want to talk about what I’d track for your SEO specifically.